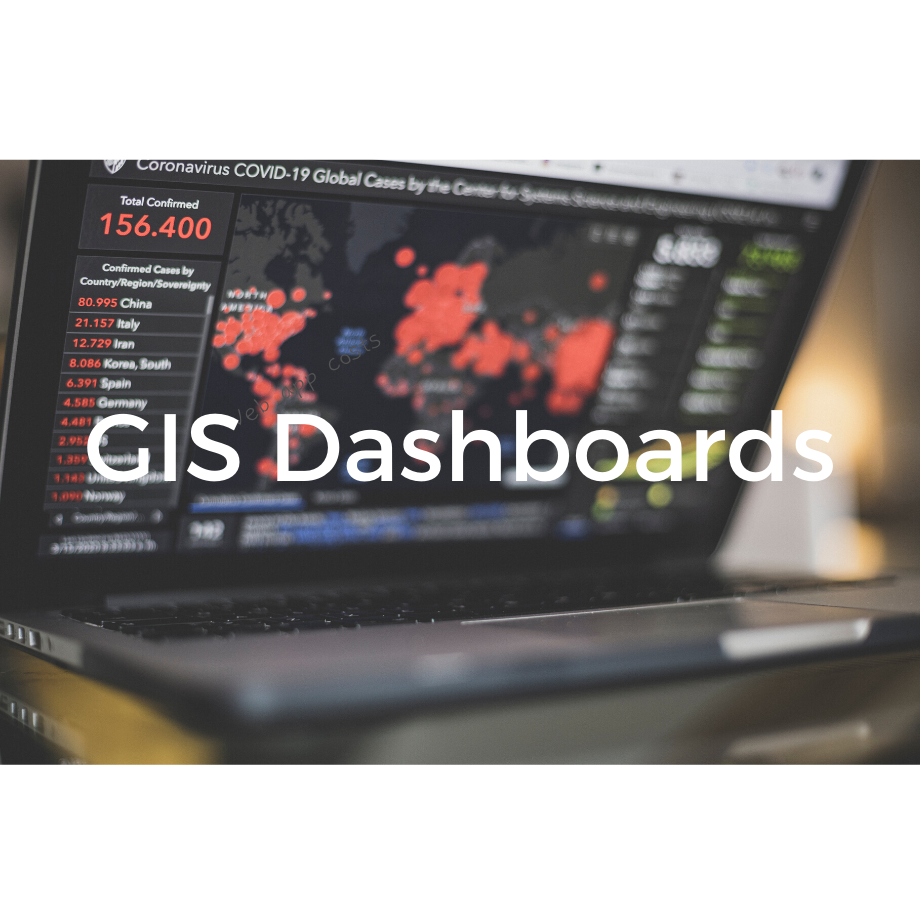
In a data-driven environment, actionable intelligence is the impetus to transparent business processes and informed decision-making, and can be achieved with a well-built GIS dashboard. Only then you can take your business to unfathomable heights.
According to Geospatial World, dashboards have proven to be most helpful ever since WHO declared Covid-19 as a global pandemic.
Gone are the days when people based their decisions on spreadsheets alone— when it comes to geographic information systems, the cutting-edge technologies have made the data derivation relatively simple with tools that are friendlier than ever.
With streams of data coming from various sources, developing a responsive GIS dashboard with open source tools and libraries can bring meaning to the continuous flow of geo-data. All you need is an intelligence tool to refine, analyze, and most importantly, visualize data in a presentable way. And for this purpose, the world is now witnessing a well-risen demand for data dashboards.
If you haven’t utilized data dashboard software as yet, a lot of questions must be surfacing your mind right about now — questions such as, ‘what dashboards actually do?’, and ‘whether you need one’.
Dashboards contain all the necessary tools that help in data extrapolation and analysis. Furthermore, the data is presented in a visually appealing way through interactive maps to reduce response time and aid the user in managing a project smoothly.
There are generally three types of data dashboards that can suit your business needs i.e. operational, strategic, and analytic. Talking about operational dashboards, they are ideally designed to provide the most updated information about the occurrences happening in the world — such as changing events, activities, and incidents. Similarly, strategic dashboards are the cornerstone of effective decision-making. They are used by executives and senior managers of the organization to monitor and analyze the metrics and set KPI’s.
However, some dashboards are neither to monitor operations nor to analyze the organizational performance, such web apps are more data-driven, that identify trends and characteristics of the data. And at times, they can have all the mentioned qualities and service employees at all levels.
However, most common users of dashboards belong to the GIS industry or a domain. The GIS Specialists, geospatial data experts, and project managers who are responsible for the completion of the projects use geovisualization tools to make informed decisions. Libraries like D3.js, OpenLayers, and Leaflet JavaScript library helps to create powerful mapping features for web and mobile platforms.
Geospatial dashboards not only save a considerable amount of time but also offer validity and accuracy when gathering information. Here are the ways dashboards help in decision-making:
There is more to open-source software than most people know. With highly configurable functionality, it is a powerful software that can run multiple iterations with variants of a single project. Especially when it comes to GIS application development, where the complexity of the project requires continuous modifications, open-source software frameworks come in handy. For instance, many programmers prefer python programming for GIS considering its quick deployment and features to perform interactive visualization.
Click here for consultation.


